Source: BioPharmCatalyst.com
For those not familiar with the Run-Up method, here is the concept:
Biotech companies spend between $325M and $750M from development to approval of a new drug, a process that takes about 8-10 years. This begins with the creation of the drug, then is followed by phase I, II, and III clinical trials- all under the watchful eye of the FDA. Only at this point are some drugs assigned a date, at which approval or denial is to be announced. This decision date is known at least 6 months in advance. The Run-Up method involves locating and buying shares of these companies well before their decision date, riding the share price up, and selling BEFORE the FDA announces their decision. The concept can also be applied to clinical trials with data releases. The goal is simple: Minimize risk while maximizing consistent profits.
Source: BioRunUp
Traders seem to be taking interest in the stock lately and given the catalysts above, we believe that the Run-Up method may be an explanation.
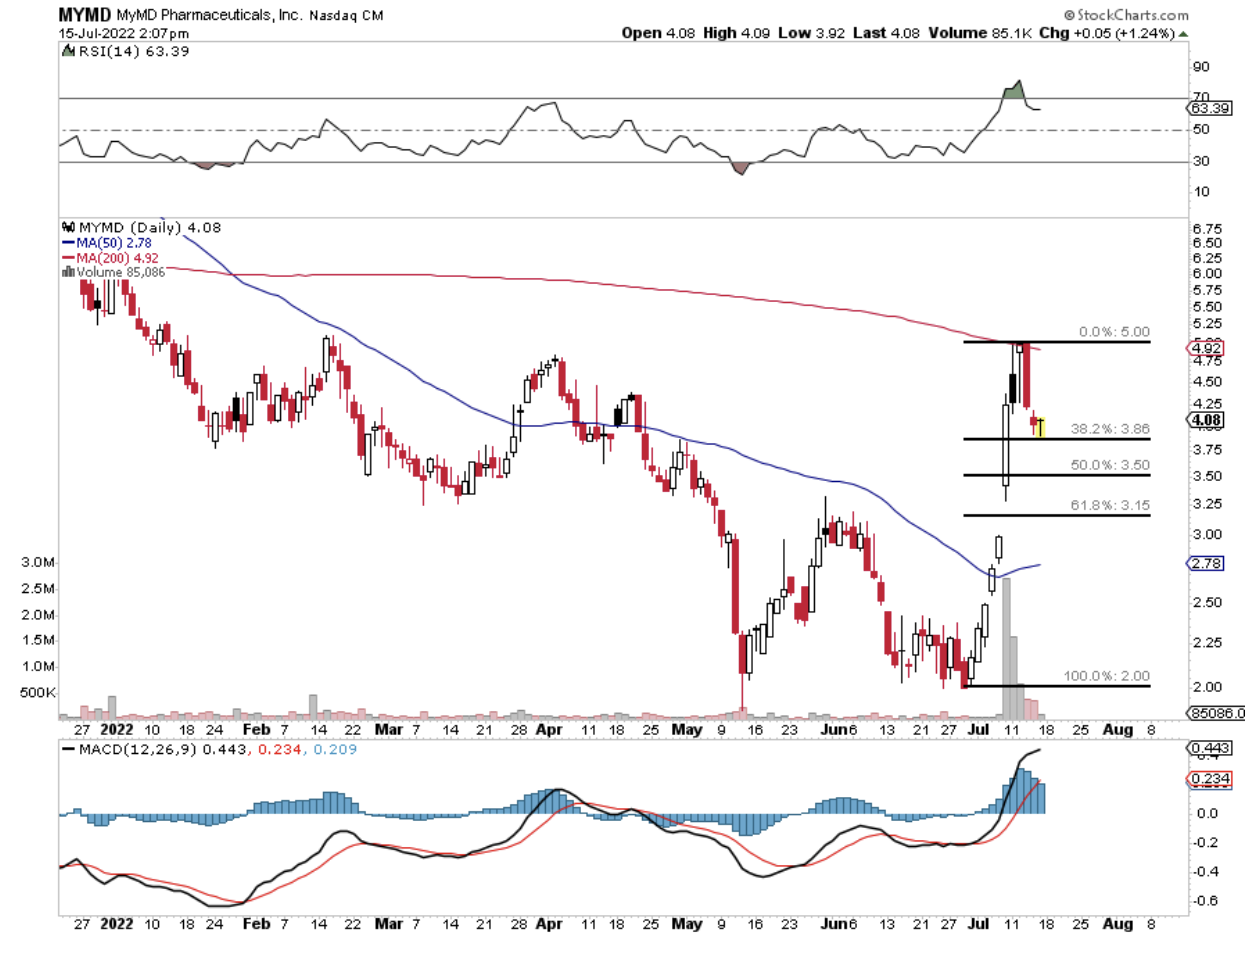
Second, let’s address Fibonacci Retracement. This is a tool used to identify support and resistance levels for technical trading.
The concept is simple supply and demand. When a stock makes a move like MYMD just did, from $2 to $5, it naturally cools off and retraces to a support level because buyers start to see risk in chasing the move. This makes retracement levels potentially attractive for new traders speculating that the share price will increase in the future.
The idea is if the 38.2 – 61.8% retracements hold, the initial move is attracting new buyers at elevated Fibonacci support levels. The less retracement, the better because that suggests traders want to pay more to get in the stock.
The first level seen here is 38.2% retracement, suggesting that traders are accumulating this support looking for the next move. If a stock retraces past the 61.8% level then it tells us traders aren’t willing to pay any reasonable level of retracement.
With MYMD holding above $4 (the first level of fib retracement) for over a week now it may not happen but we see this as a potentially bullish sign.

View Full Image
As traders, we look for clues on why a stock is moving higher and more importantly, why it might continue to move higher. The BioRunup method is well known to traders as is Fibonacci. Stocks move due to demand and catalysts are the things that cause demand. Upcoming catalysts and strong accumulation could bode well for MYMD here.
Of course, no strategy is foolproof and investors could lose money investing in MYMD now, but as we learn not to chase moves but instead buy support zones, Fibonacci is the tool we often refer to. And as we try to understand whether a stock will continue or not, upcoming catalysts are seen as potential drivers.
Right now MYMD meets both of those, so we may be biased and its by no means a sure thing but we like it*!